The problem isn't a lack of data. It's the opposite. CRMs generate more metrics than most teams know what to do with, and without a clear framework, you end up drowning in dashboards that don't drive decisions. What matters is knowing which handful of metrics deserve your attention, and how to act on them before small problems become missed quarters.
That's exactly what we built Vedain CRM to solve. With built-in pipeline reports, conversion funnels, team leaderboards, and sales target tracking, it gives sales leaders a clear read on performance without stitching together spreadsheets or paying for bolt-on analytics. Every feature ships at $10/user/month, no tier upgrades required.
This guide breaks down the specific KPIs worth tracking, how to measure them accurately, and the methodology behind building a performance tracking system that actually helps your team sell more. Whether you're managing five reps or fifty, you'll walk away with a repeatable framework you can implement this week.
What tracking sales performance should look like
Most teams track performance the same way they track expenses: reactively. A rep misses quota, a manager pulls a report, and everyone scrambles to explain what happened. Reactive tracking doesn't improve performance; it only documents failure after the fact. Effective performance tracking gives you a live view of what's happening in your pipeline so you can course-correct before the quarter closes.
The right system has three layers working together: leading indicators (activity metrics that predict future results), lagging indicators (outcome metrics like revenue closed), and diagnostic metrics (conversion rates and cycle lengths that explain the gap between the two). When you understand how to track sales team performance using all three layers, you stop guessing and start managing with precision.
Tracking only closed revenue tells you what happened. Tracking leading indicators tells you what's about to happen.
The difference between activity metrics and outcome metrics
Activity metrics measure what reps do: calls made, emails sent, meetings booked, proposals submitted. Outcome metrics measure what results from those activities: deals won, revenue generated, and average deal size. Both matter, but they serve different purposes.
Activity metrics help you identify effort and process problems early. If a rep's call volume drops 40% in week two of the month, you know about it now, not at the end of the month when it shows up as a missed number. Outcome metrics confirm whether that activity is actually converting into revenue, which tells you whether the problem is effort, skill, or deal quality.
Neither type works in isolation. High activity with low conversion signals a skill or targeting problem. Low activity with high conversion might mean your best rep is running out of pipeline. You need both data points together to draw any useful conclusion, and you need them updated in real time rather than pulled manually at the end of each week.
Why conversion rates are the most diagnostic metric
Conversion rates connect your activity metrics to your outcome metrics and show you exactly where deals stall. Tracking conversion at each stage - lead to qualified, qualified to demo, demo to proposal, proposal to close - gives you a precise view of where your process breaks down rather than a vague sense that something is off.
A rep with a strong close rate but weak demo-to-proposal conversion has a specific, fixable problem. Maybe they struggle with written proposals, or maybe they run too many demos with unqualified prospects. You can diagnose and address that directly. A rep with strong conversion across every stage is someone worth learning from, and their process deserves documentation your whole team can use.
What a clean tracking system actually requires
Before you can track anything accurately, your team needs to update the CRM consistently. Garbage data produces garbage reports, and most performance tracking failures come down to incomplete or inconsistent data entry rather than the wrong choice of metrics.
A clean system means reps log every interaction at the time it happens, stages advance only when criteria are genuinely met, and close dates reflect real expected timelines rather than end-of-month defaults. When your data is clean, your pipeline reports and conversion funnels reflect reality. When it isn't, your dashboards become decoration.
Equally important is upfront agreement on what each pipeline stage actually means and what criteria must be met before a deal moves forward. Without stage definitions everyone follows, two reps can carry identical pipeline values with completely different quality underneath. That makes rep-to-rep comparisons meaningless and any revenue forecast unreliable from the start.
Step 1. Set goals and define what good looks like
Before you choose a single KPI, you need clarity on what success looks like for your team. Without defined targets, any metric you track becomes a number without context, and you'll struggle to tell the difference between a rep who's slightly behind and one who's headed for a serious miss. Setting goals upfront gives every number a reference point and makes the entire tracking process meaningful.
Start with your sales targets, then work backward
Most managers set a revenue target and stop there. A more useful approach is to take that target and reverse-engineer the activity and conversion benchmarks your team needs to hit it. If your team needs to close $50,000 in new business each month and your average deal size is $5,000, you need 10 closed deals. If your close rate is 25%, you need 40 qualified opportunities entering the pipeline each month. That backward math is exactly how to track sales team performance at a granular level, rather than staring at a revenue gap on the last day of the month.
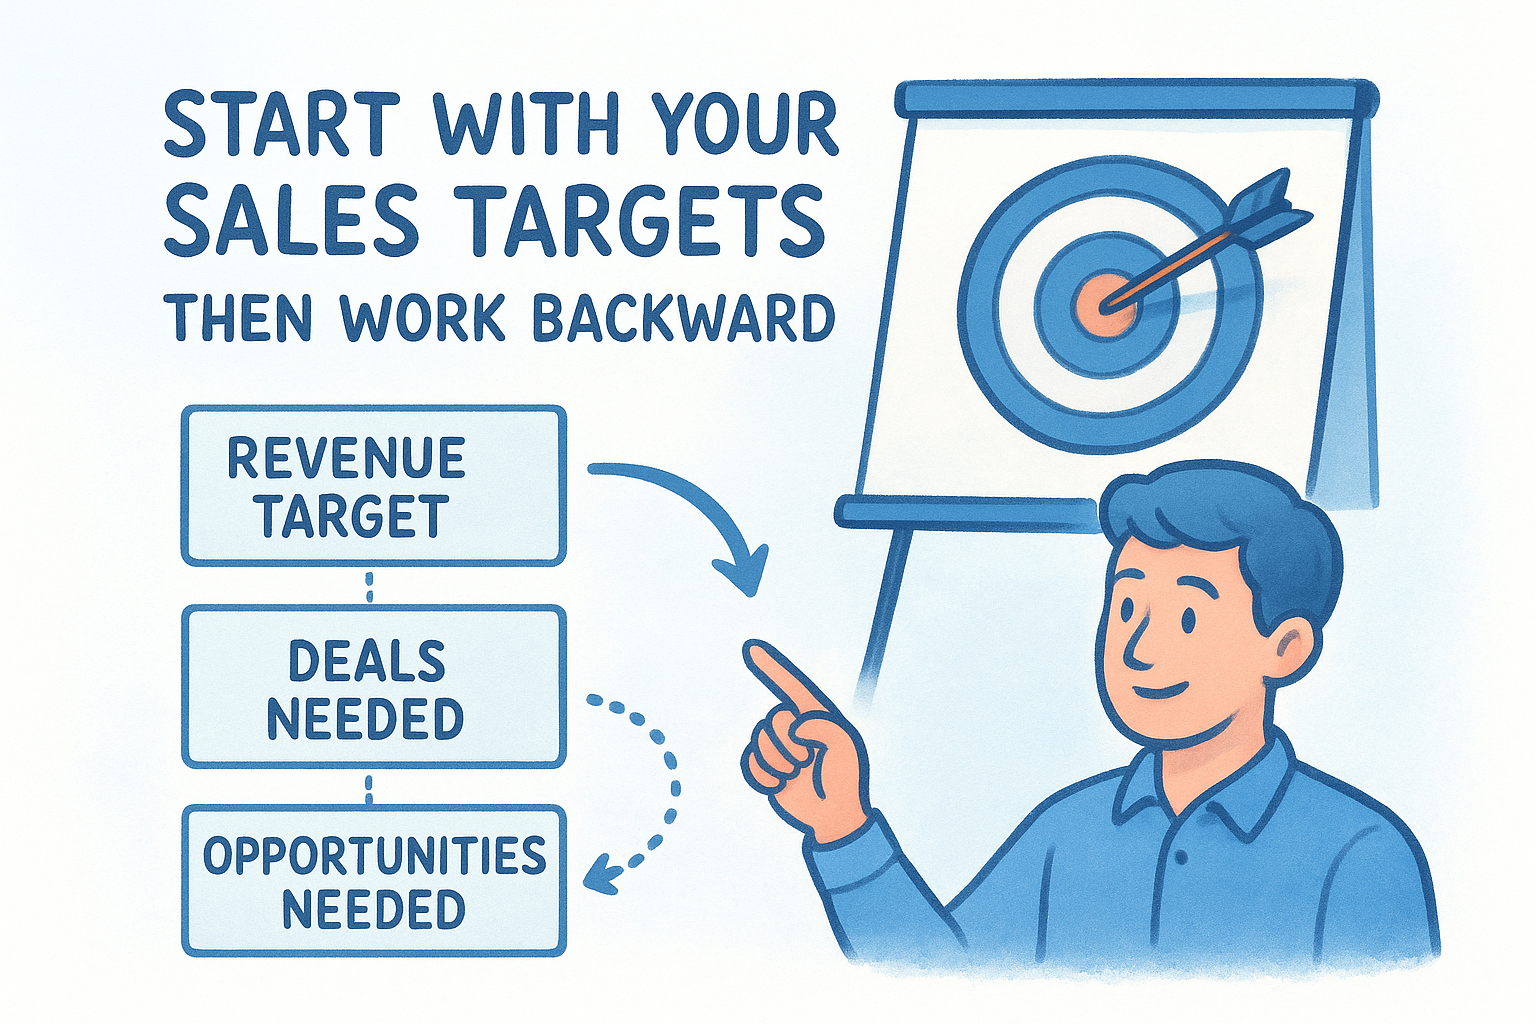
Your revenue target is the destination. Your activity benchmarks are the road map that gets you there.
Use this framework to work backward from any revenue goal:
Define benchmarks at the rep level, not just the team level
Team-level targets hide individual performance problems. A rep hitting 150% of quota can mask another rep sitting at 50%, and the blended number looks acceptable until you lose your top performer and the whole team misses. Set individual targets for each rep based on their tenure, territory, and historical conversion rates so problems surface early.
New reps should have a ramp period with separate benchmarks for their first 30, 60, and 90 days. An experienced hire might be expected to build pipeline immediately, while someone earlier in their career needs activity benchmarks weighted more heavily than revenue for the first quarter. Document these expectations in writing so there is no ambiguity about what good looks like for each person, and revisit them quarterly as your team's data matures.
Step 2. Pick KPIs that match your sales motion
Not every KPI belongs on every team's dashboard. A high-volume, short-cycle team closing deals in three days needs completely different metrics than a team running six-month enterprise deals. Picking the wrong KPIs means tracking things that feel relevant but don't actually reflect how your team sells, which makes understanding how to track sales team performance harder rather than easier. Before you build any dashboard, identify your sales motion first, then choose metrics that map directly to how deals actually move through your pipeline.
Core KPIs every team needs
Regardless of your sales motion, a handful of foundational metrics apply to every team. These give you a reliable baseline read on performance across activity, pipeline health, and revenue outcomes. Start here before adding anything more specific.
- •Quota attainment: The percentage of each rep's revenue target closed in the current period
- •Win rate: Deals won divided by total deals closed, both won and lost
- •Average deal size: Total revenue closed divided by the number of deals won
- •Sales cycle length: Average number of days from opportunity created to closed-won
- •Pipeline coverage: Total pipeline value divided by revenue target, with 3x as a healthy floor
If your pipeline coverage drops below 3x your target, you have a generation problem that will show up as a revenue miss within 30 to 60 days.
KPIs for high-volume, short-cycle teams
If your team closes deals quickly and in large numbers, activity metrics carry more predictive weight because the feedback loop between effort and result is short. Small drops in daily activity compound fast when deal cycles last two to four weeks, so you need visibility into rep behavior in near real time, not at the end of the month.
Add these KPIs to your core set if your average deal closes in 30 days or fewer:
KPIs for longer, complex sales cycles
Longer deals require more diagnostic metrics because the feedback loop between activity and revenue outcome stretches over months. Stage-by-stage conversion tracking becomes critical here, since a deal sitting in "proposal sent" for 45 days without movement is a risk you need to catch now, not at quarter-end review.
Add these metrics if your average deal takes 60 or more days to close:
- •Stage conversion rates tracked at each individual pipeline stage
- •Deal velocity: how quickly opportunities move between stages on average
- •Stakeholder engagement: the number of contacts touched per account
- •Forecast accuracy: how closely your predicted close amounts match actual results each period
Step 3. Capture clean data in your CRM from day one
Clean data is the foundation of everything in this guide. Every dashboard, conversion rate, and performance report is only as reliable as the data your reps enter, and if that data is inconsistent, incomplete, or entered days after the fact, your metrics will mislead you. Understanding how to track sales team performance accurately starts here, before you build a single report.
The most common reason sales tracking fails isn't choosing the wrong metrics. It's choosing the right metrics and feeding them bad data.
Define stage criteria before anyone enters a deal
Without written definitions for each pipeline stage, two reps will interpret "demo scheduled" completely differently. One rep logs it when the meeting invite goes out; another waits until the prospect actually attends. That gap makes your conversion rates unreliable and your pipeline value meaningless as a forecasting tool.
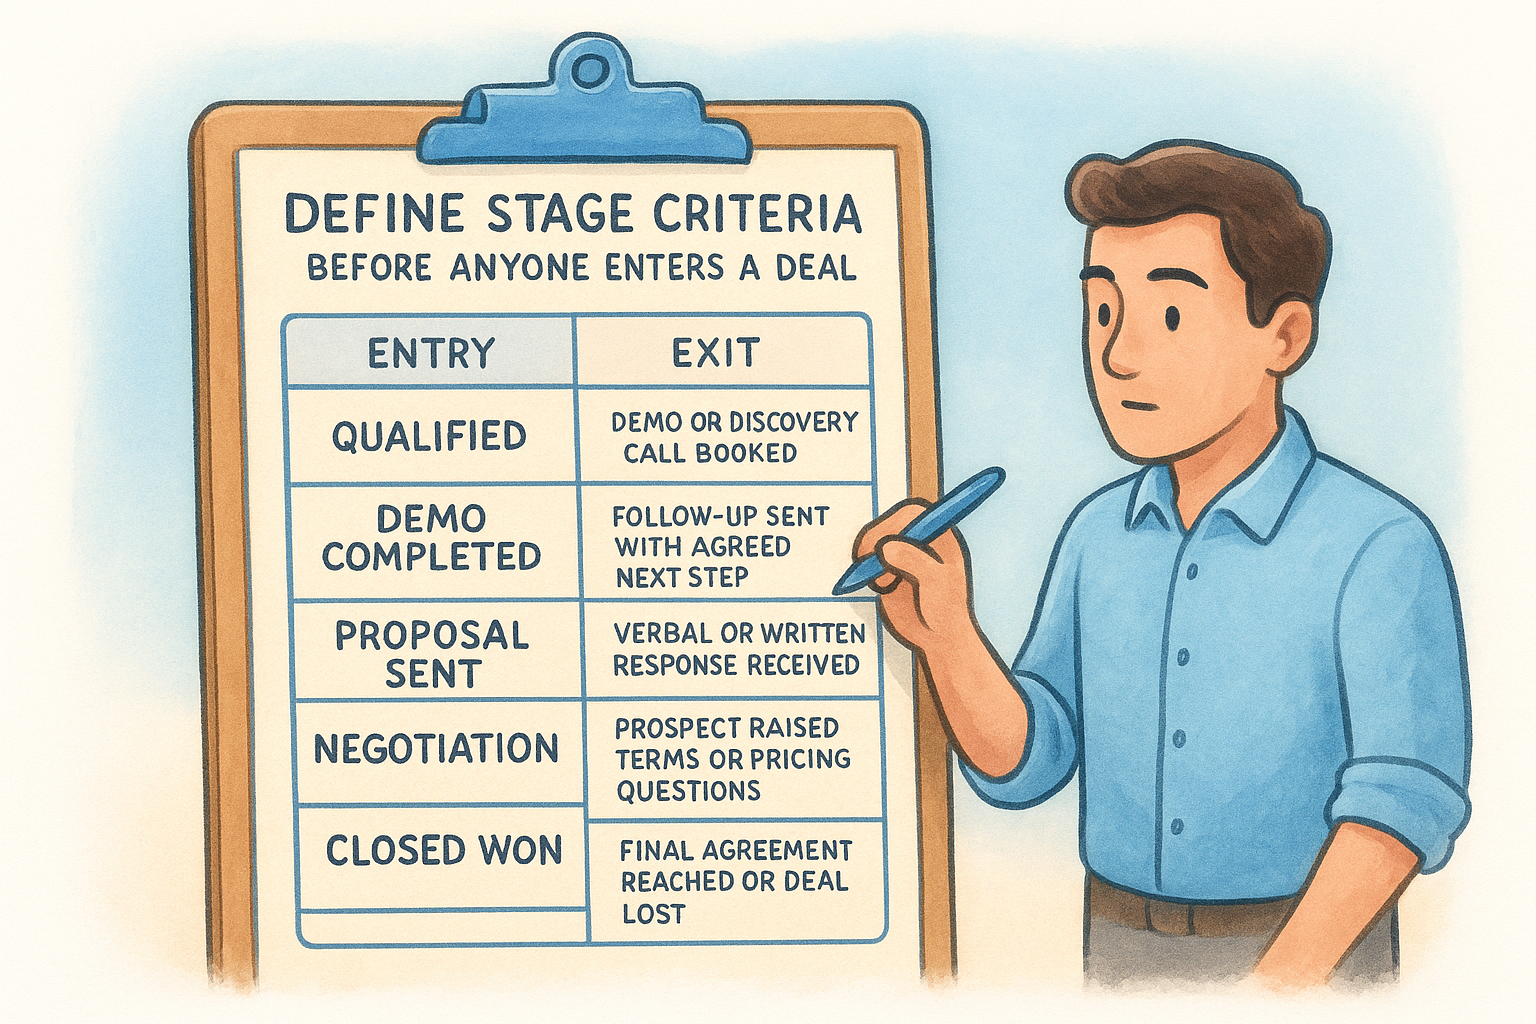
Set clear entry and exit criteria for every stage before your team starts entering deals. Here's a template you can adapt directly:
Post this somewhere every rep can reference it and enforce it from the first deal entered.
Set three non-negotiable data entry rules for your team
Most data quality problems trace back to a handful of bad habits rather than any systemic failure. Requiring your team to follow three simple rules eliminates the majority of data entry issues before they pollute your reports.
Apply these rules without exceptions:
- •Log every interaction same-day: Call notes, email summaries, and meeting outcomes go into the CRM before the rep closes their laptop, not the following morning.
- •Advance stages only when criteria are met: Reps cannot move a deal forward until the defined exit criteria for the current stage are satisfied.
- •Use real close dates: Close dates should reflect the actual expected decision timeline, not the last day of the current month as a convenient default.
Reviewing compliance weekly during your first pipeline review catches drift early, before bad habits normalize. Once clean data entry becomes routine, every report you pull will reflect what is actually happening in your pipeline rather than what reps got around to logging.
Step 4. Build dashboards reps and managers will use
A dashboard nobody checks is just a report that generates itself. The most common reason dashboards fail is that they're built for the person who designed them, not for the people who need to act on them. When you think about how to track sales team performance through dashboards, your starting point should always be the audience: what decision does this person need to make, and what data do they need to make it fast? Build two separate dashboards, one for reps and one for managers, because their questions are fundamentally different.
Build a rep-facing dashboard for daily self-management
Reps need a dashboard that answers one question at a glance: am I on track to hit my number this month? If a rep has to dig through multiple reports to answer that question, they won't. Keep the rep dashboard simple, forward-looking, and limited to the metrics the rep can directly influence each day.
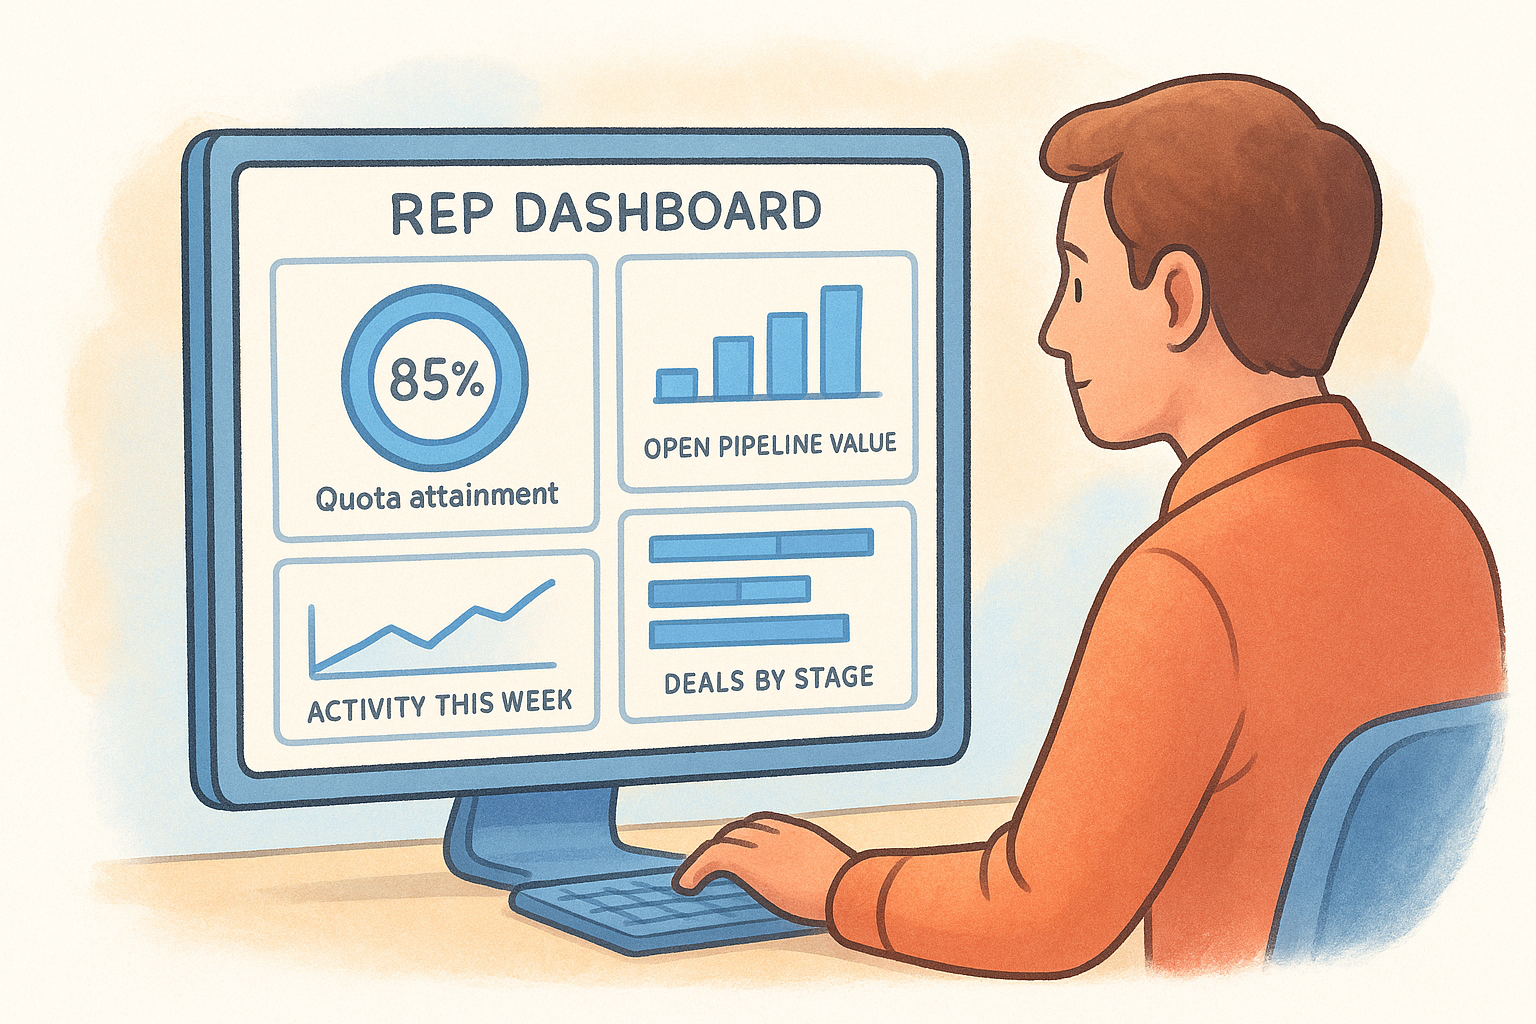
A rep dashboard should tell them what to do next, not just what they did last week.
Include these widgets on every rep's dashboard:
Keep the rep dashboard to five or six widgets. Adding more than that splits attention and makes the dashboard harder to act on, not easier.
Build a manager-facing dashboard for pipeline oversight
Managers need a different view entirely. Their job is to spot risks across the whole team, identify which reps need coaching, and confirm the pipeline is healthy enough to hit the team's number. A manager dashboard should surface exceptions rather than averages, because averages hide problems.
Your manager dashboard should include team leaderboard rankings by quota attainment, individual rep conversion rates at each pipeline stage so you can spot where deals stall, pipeline coverage per rep, average sales cycle length broken out by rep, and deals with no activity in the past seven or more days. That last widget is critical: stalled deals are where revenue silently disappears. Set the inactivity threshold to match your average sales cycle, so a deal that should close in 14 days flags after five days without a logged touchpoint, not after 30.
Step 5. Run a review cadence that improves performance
Tracking data without a structured review process is like checking your speedometer without looking at the road. The data only becomes useful when you build a regular cadence that puts the right metrics in front of the right people at the right time. Knowing how to track sales team performance means nothing if your team never stops to act on what the numbers are telling them. Your review cadence should have two distinct layers: a short weekly check on pipeline health, and a deeper monthly performance conversation at the rep level.
Hold a weekly pipeline review focused on risk, not recaps
Your weekly pipeline review should run no longer than 30 minutes and cover only deals that need attention, not every open opportunity in the system. If every deal gets equal airtime, you waste time on healthy deals and shortchange the ones at risk.
A good pipeline review surfaces decisions that need to happen this week, not history that already happened last week.
Run the meeting using this structure every time:
Before the meeting closes, every stalled deal needs a clear next step with a named owner and a deadline. If a deal can't produce a defined next step, it probably belongs in a lower stage or should be marked lost.
Run monthly one-on-ones that connect data to development
Your monthly one-on-one with each rep is where individual performance data turns into a coaching conversation. Pull each rep's stage-by-stage conversion rates, quota attainment, and activity metrics from the past 30 days before the meeting so you walk in with specific evidence rather than general impressions.
Structure each monthly conversation around three questions: Where did performance meet expectations, where did it fall short, and what one thing will we work on next month? Keeping the action item to one specific improvement per month prevents the session from becoming an overwhelming list that nobody follows through on. A rep with a weak demo-to-proposal conversion rate needs focused work on that specific skill, not a broad directive to "do better across the board." Specificity is what makes these conversations useful rather than just scheduled check-ins that reps dread.
Templates and examples you can copy
Reading about how to track sales team performance is useful. Having a ready-made template you can drop into your CRM or a shared doc on Monday morning is better. The three templates below cover the core tracking needs for most sales teams: a weekly pipeline scorecard, a monthly rep performance snapshot, and a one-on-one coaching agenda. Copy and adapt them directly instead of starting from scratch.
Weekly pipeline scorecard
Use this scorecard every week to give your team a single-page view of pipeline health. Fill it in before your weekly pipeline review meeting so the conversation starts with shared data rather than someone pulling numbers live.
If more than two rows show "At risk" in the same week, you have a systemic problem, not an individual one.
Bring this completed scorecard to every weekly meeting and compare it against the prior week to spot trends before they become emergencies.
Monthly rep performance snapshot
Run this snapshot for each rep before their monthly one-on-one. Pull every number directly from your CRM so the data is objective and the conversation stays focused on specifics rather than impressions.
Monthly one-on-one coaching agenda
Structure every one-on-one using the same agenda so reps know what to expect and come prepared. Consistency reduces anxiety and makes the sessions more productive over time.
- Review the performance snapshot (10 minutes): Walk through the numbers together and ask the rep to share their interpretation first before you offer yours.
- Identify one strength (5 minutes): Name a specific metric or behavior that improved and explain why it mattered.
- Identify one development area (10 minutes): Pick the single conversion rate or activity metric with the most room to improve. Agree on a specific action, not a vague goal.
- Set next month's focus (5 minutes): Write it down and send a follow-up summary within 24 hours so there is a written record both parties can reference.
Keep improving without adding busywork
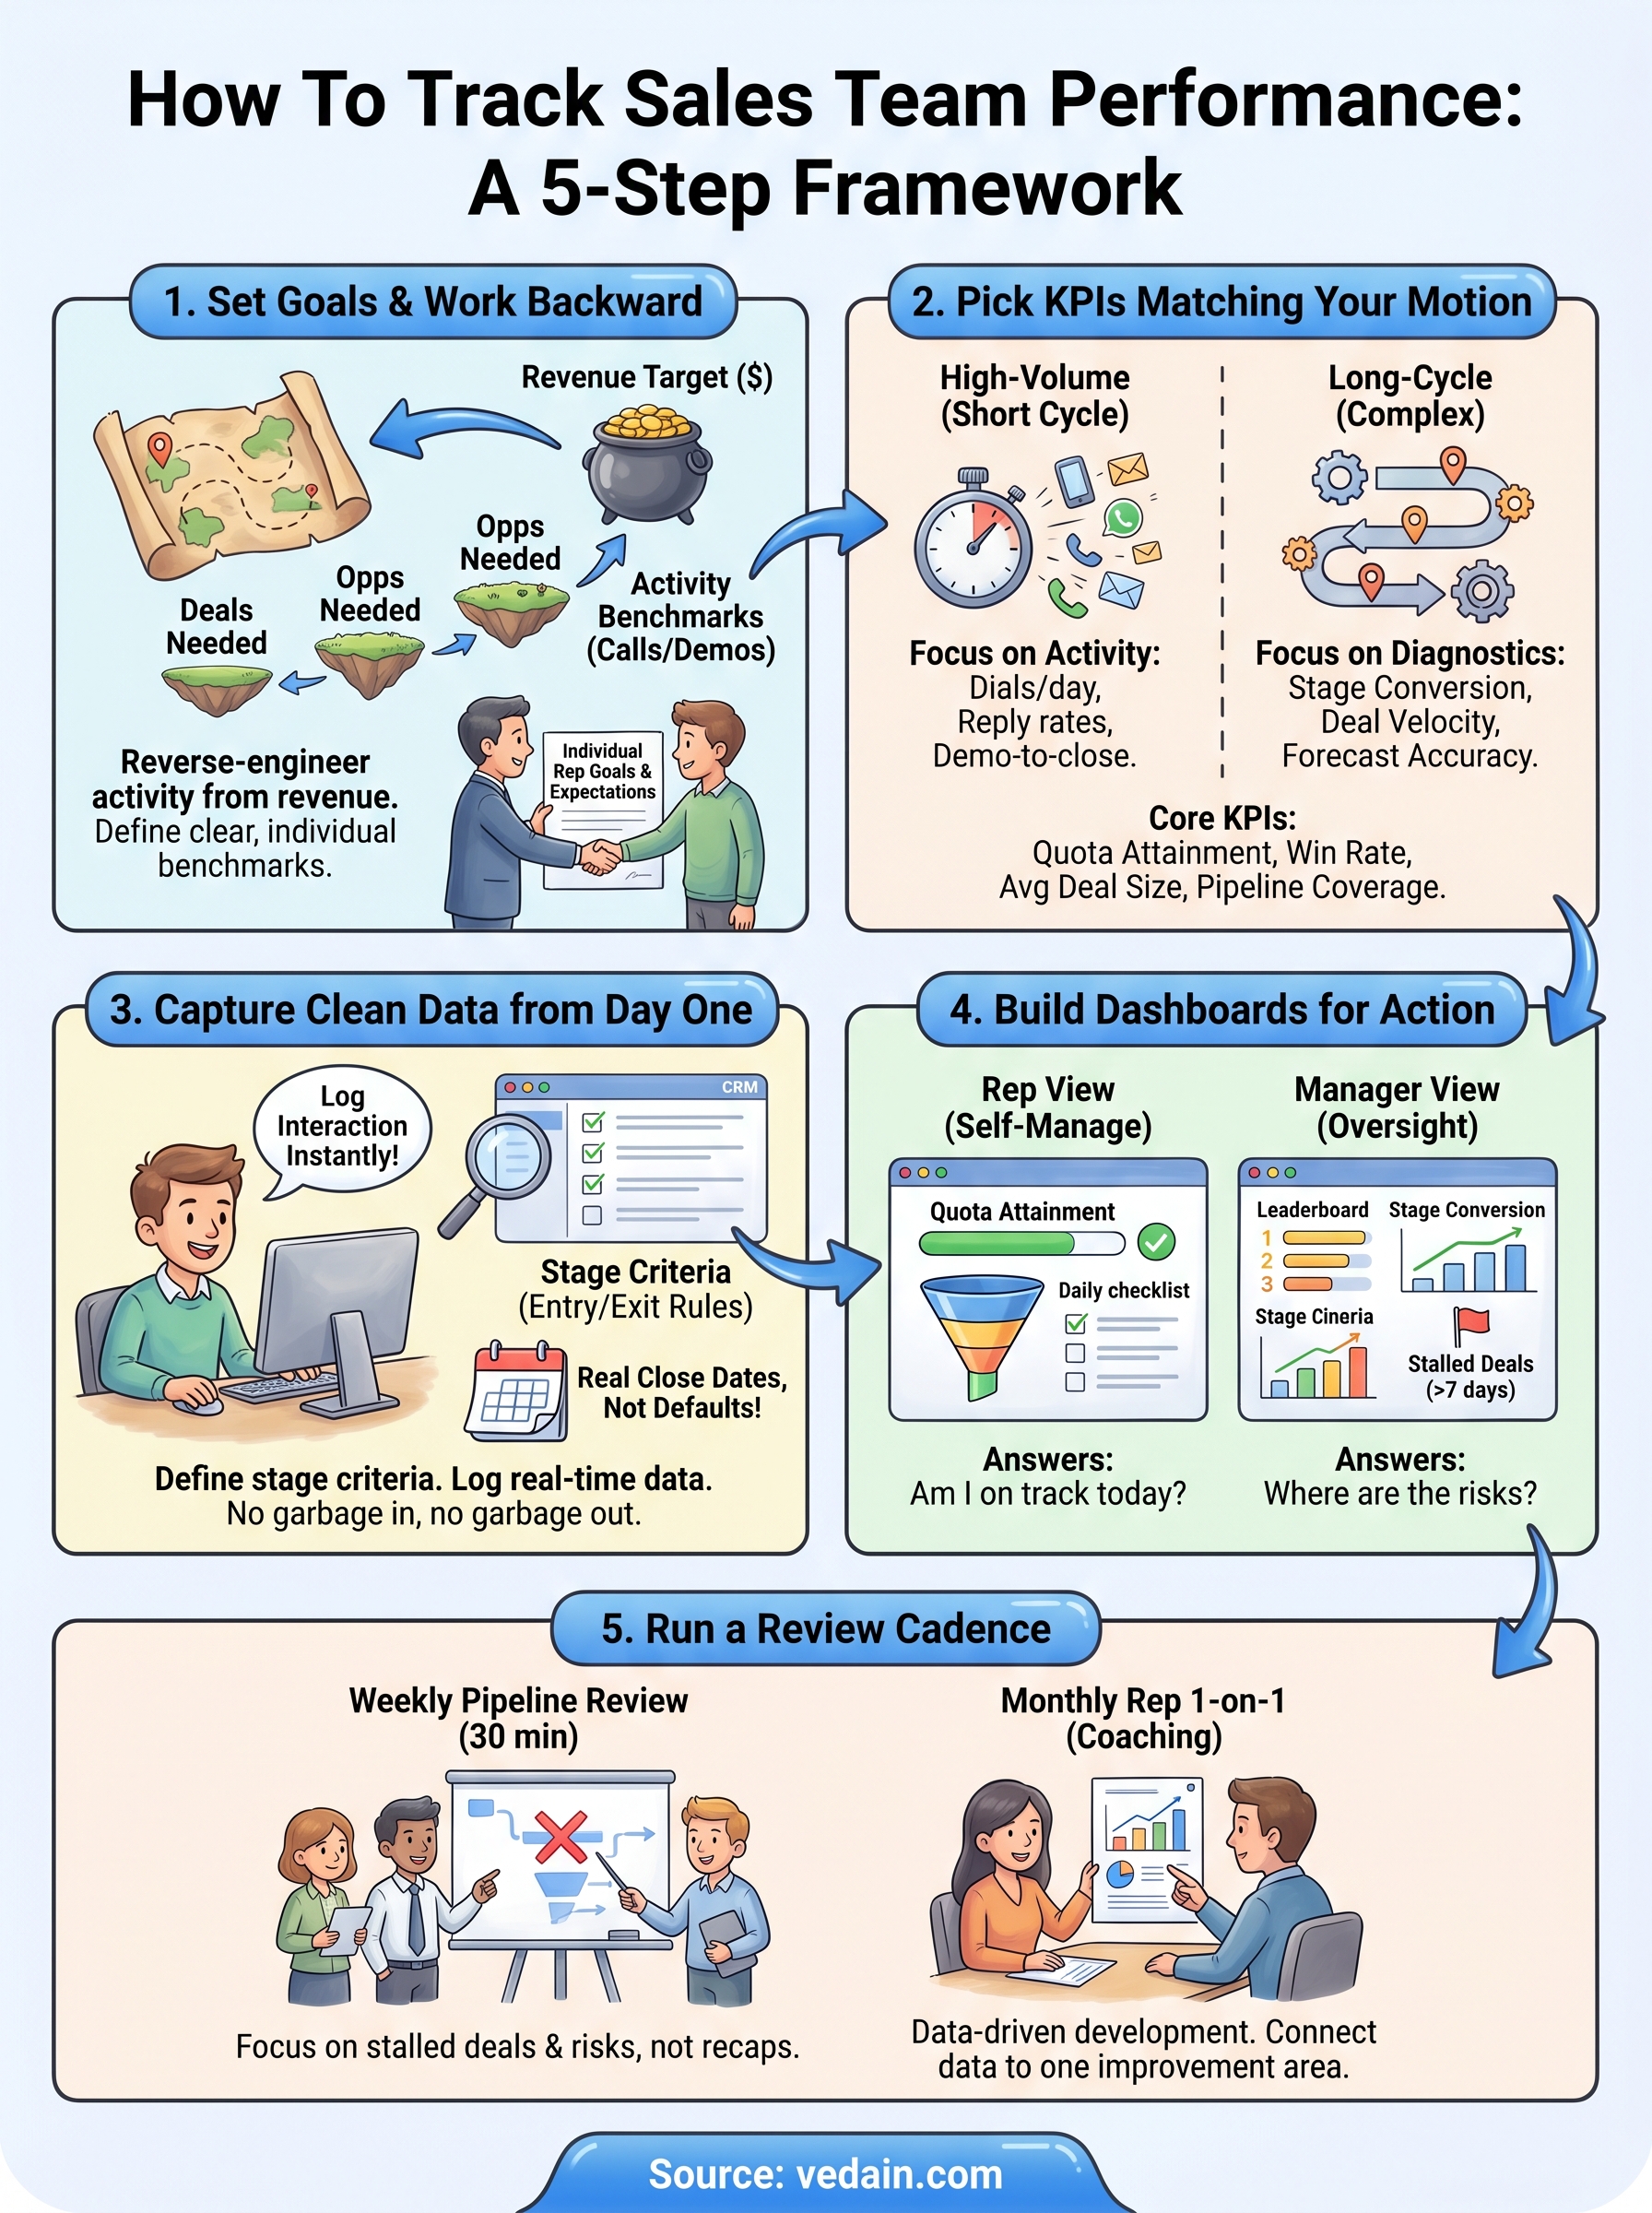
The goal of learning how to track sales team performance isn't to create more meetings or more reports. It's to give your team clearer signals so they spend less time guessing and more time selling. Start with the five steps in this guide: set defined goals, pick KPIs that match your motion, lock in clean data habits, build dashboards people actually open, and run a review cadence that leads to action. That stack covers everything most teams need.
Revisit your KPIs every quarter and cut any metric nobody references in your weekly or monthly reviews. If a data point doesn't drive a decision, it's just noise. Performance tracking compounds over time, but only if you keep it lean enough that your team stays consistent with it. When you're ready to put this into practice with a CRM that has reporting built in from day one, start a free trial of Vedain CRM and see how fast a clean pipeline comes together.